Step 1 · Create a Point Grid
Create a coordinate system you can translate and rotate, then use it to generate a point grid with Dynamo's lacing.
Overview
Create a coordinate system that can be rotated and translated in coordinate space, then use it to generate a point grid that will support the framing geometry in later steps. By the end of this step you will have:
- Created a coordinate system from Cartesian coordinates.
- Rotated the coordinate system.
- Generated a point grid using the coordinate system and Dynamo's lacing functionality.
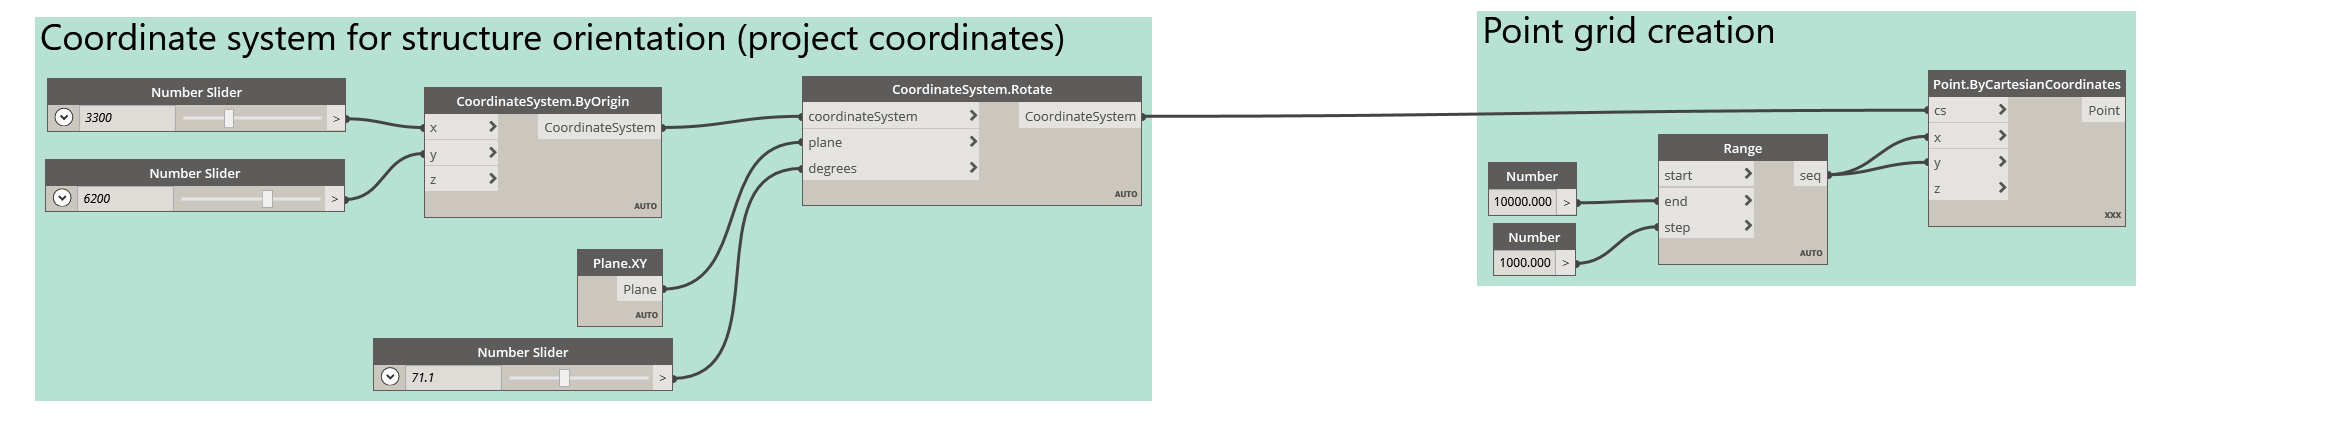
Objective 1.1: Create a coordinate system
The first step is to create a new coordinate system with inputs for its X, Y and Z coordinates. This lets you position geometry generated in Dynamo anywhere you like — typically to coordinate with your Revit model.
Add the CoordinateSystem.ByOrigin node: in the library, navigate to Geometry ▸ Abstract ▸ Coordinate System and click the node to place it on the graph. It has default inputs, so it creates a coordinate system even with nothing connected — the default origin is XYZ(0, 0, 0).
To drive the location dynamically, connect number sliders into the inputs. Right-click an empty space, search for number and choose Number Slider. Place a slider, copy it, and wire one into the CoordinateSystem.ByOrigin x input and the other into its y input. Finally, expand each slider with its drop-down arrow and set the Max to 10000mm and the Step to 100.
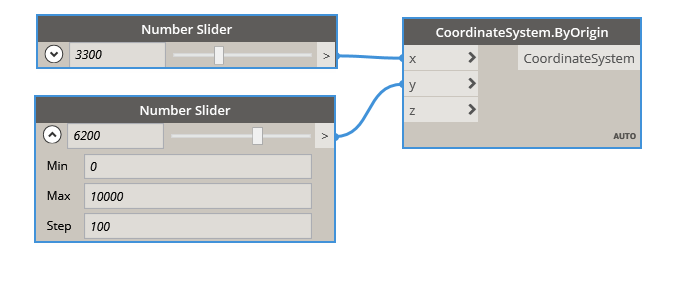 The coordinate system, with its origin driven by number sliders.
Objective 1.2: Rotate the coordinate system
The coordinate system also needs to rotate, so that any geometry that depends on it downstream transforms with it. Place the CoordinateSystem.Rotate node (it takes a plane and degrees) and connect your CoordinateSystem.ByOrigin into its coordinateSystem input.
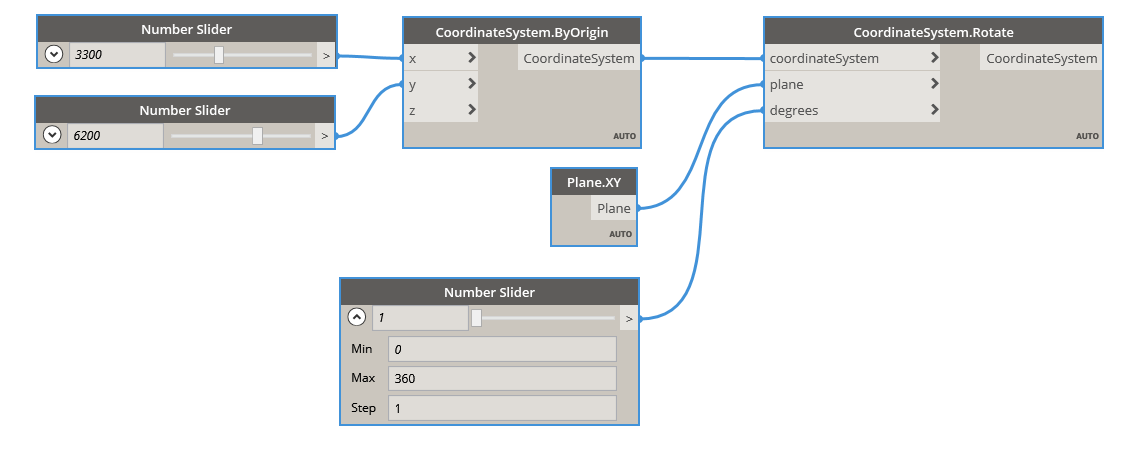
Search for the Plane.XY node, place it, and wire it into the plane input. Add a new Number Slider with a Max of 360 and Step of 1, and connect it to the degrees input.
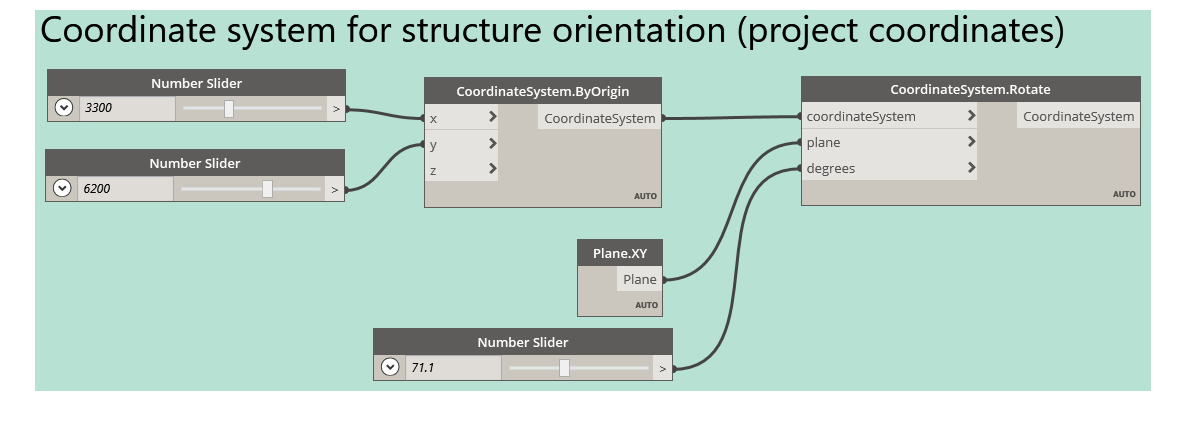
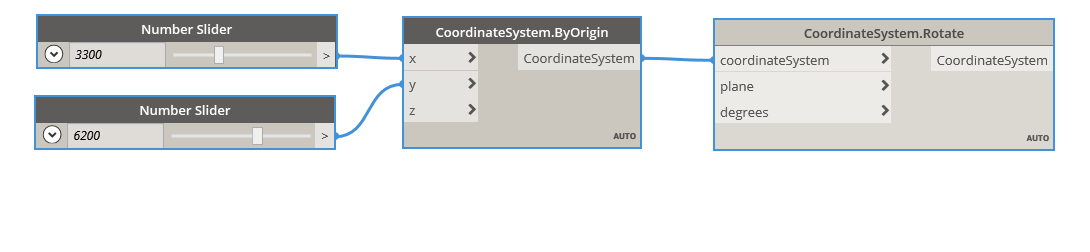 Rotating the coordinate system about the XY plane.
The coordinate system that provides the coordinate space for the parametric model is now complete. Select all the nodes, right-click and choose Group, then double-click the placeholder title and give it a concise, meaningful name. Grouping related nodes is strongly recommended — it keeps the graph legible and organised.
 Group related nodes and give the group a clear title.
Objective 1.3: Generate the point grid
The point grid can now be created from the rotated coordinate system. Generating the points from this coordinate system creates a dependency: any change to the coordinate system — its rotation, or the X/Y origin from Objective 1.1 — propagates through the graph and moves the points. This change propagation is a primary principle of procedural modelling, and what differentiates it from standard CAD.
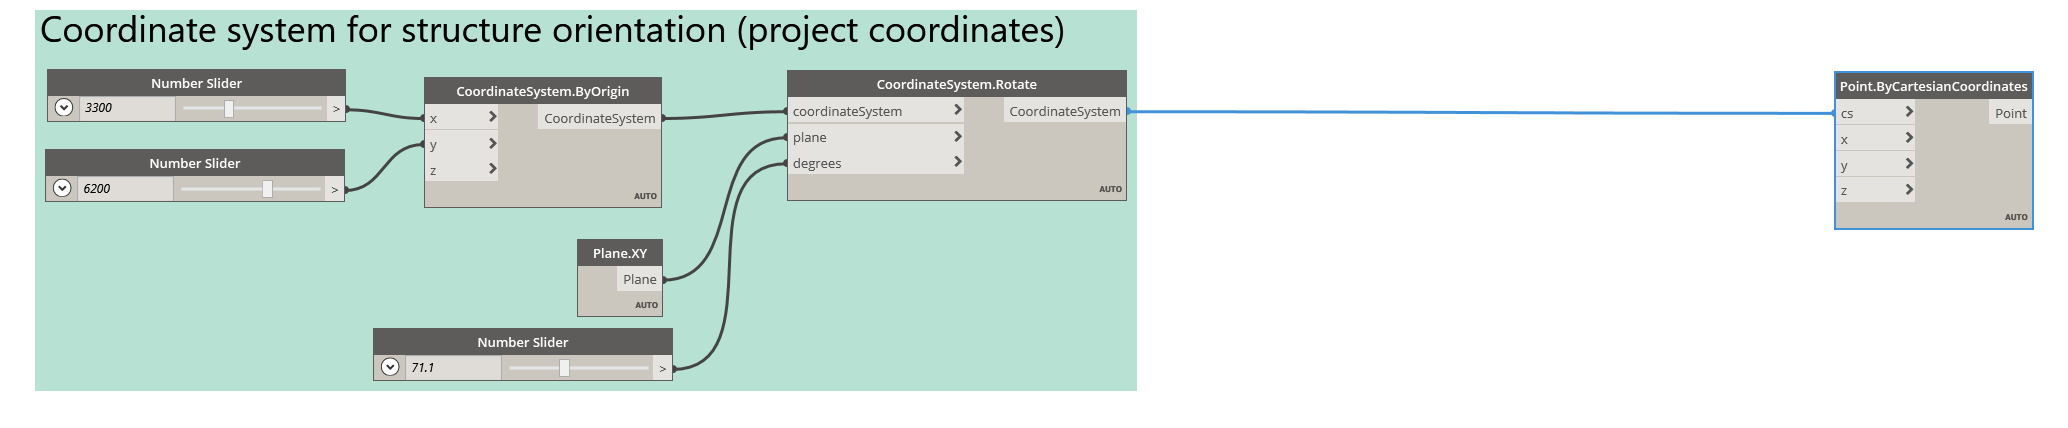
Search for the Point.ByCartesianCoordinates node and place it. Connect CoordinateSystem.Rotate into its cs input.
For the x and y inputs we'll use a number range — a list of numbers — which triggers a Dynamo behaviour called lacing.
Lacing. Lacing is what Dynamo does automatically whenever a list is fed into a node — it's how one node generates many objects at once (limited only by your computer's memory). It's fundamental to procedural programming: instead of one node per element, a single node processes a whole, variable-length list. There are three options:
- Shortest (default) — pairs items one-to-one and stops at the end of the shortest list.
- Longest — pairs one-to-one but repeats the last item of the shorter list so nothing is dropped.
- Cross Product — pairs every item of the first list with every item of the second, producing a grid.
Place a List.Range node with an end of 10000.0 and a step of 1000.0, using Number nodes to supply those values, then connect its output into both the x and y inputs of Point.ByCartesianCoordinates.
With the default Shortest lacing, notice two things: the single-value coordinate inputs are promoted to a list (a rank promotion), and the x and y lists are data-matched index-for-index — (0, 0), (1000, 1000), (2000, 2000)… — giving a diagonal line of points, all relative to the rotated coordinate system.
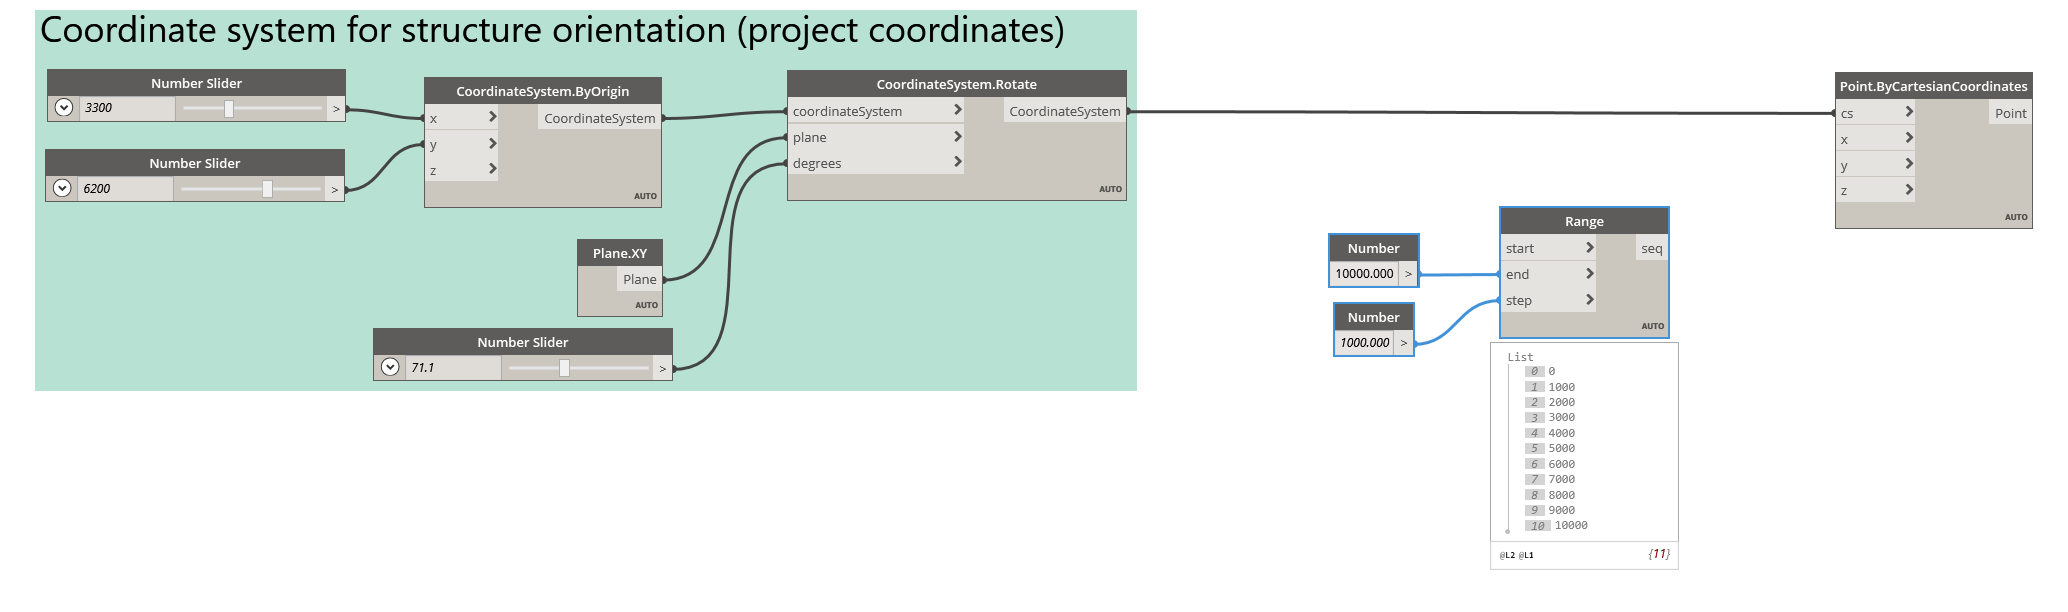 Shortest lacing pairs coordinates index-for-index.
To build a grid instead, right-click Point.ByCartesianCoordinates and choose Lacing ▸ Cross Product. Now each x is paired with every y — (0, 0), (0, 1000), (0, 2000)… — producing a 2D array (a list of lists), where each sub-list is a row of points in the grid.
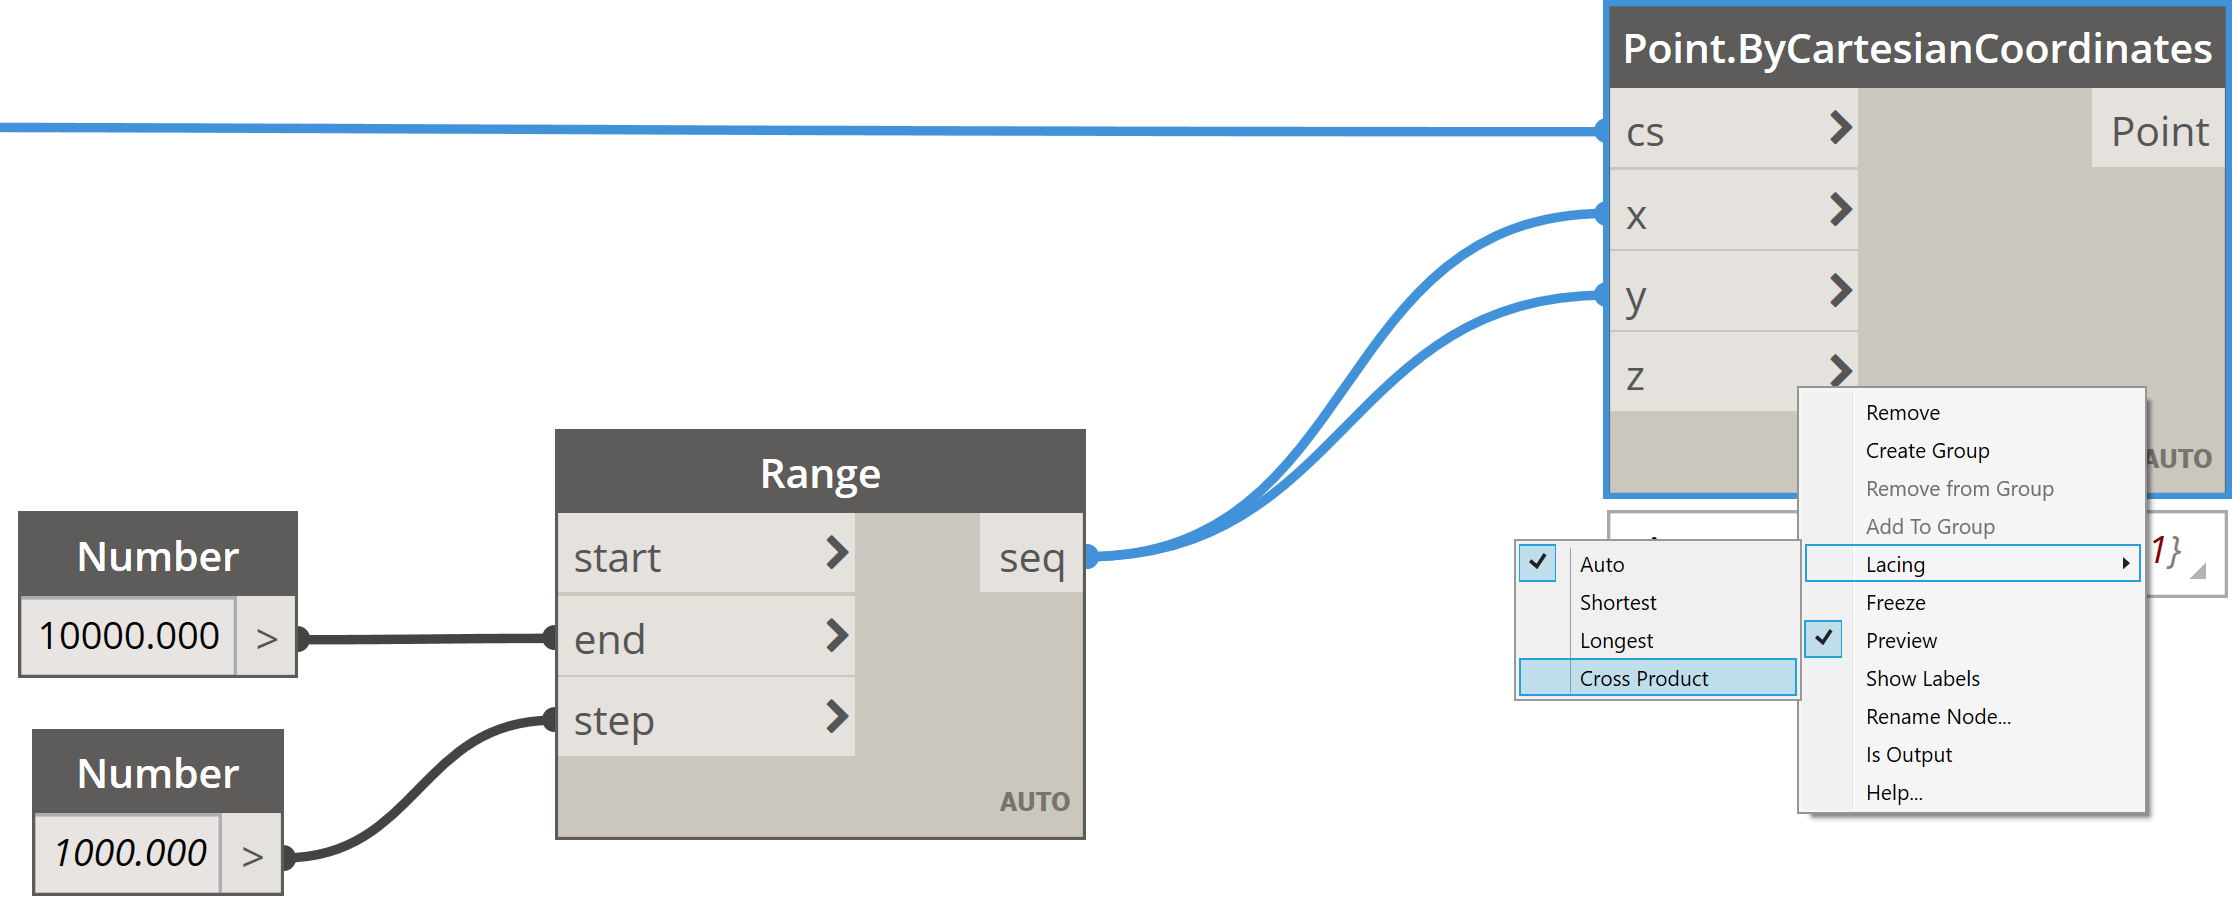 Cross Product lacing produces a grid — a list of lists.
The diagram below describes the resulting data structure. Each row is a sub-list; the first index (lists start at 0) selects a row, and the second index selects a point within it. So index [3][5] is the point in the fourth row, sixth column.
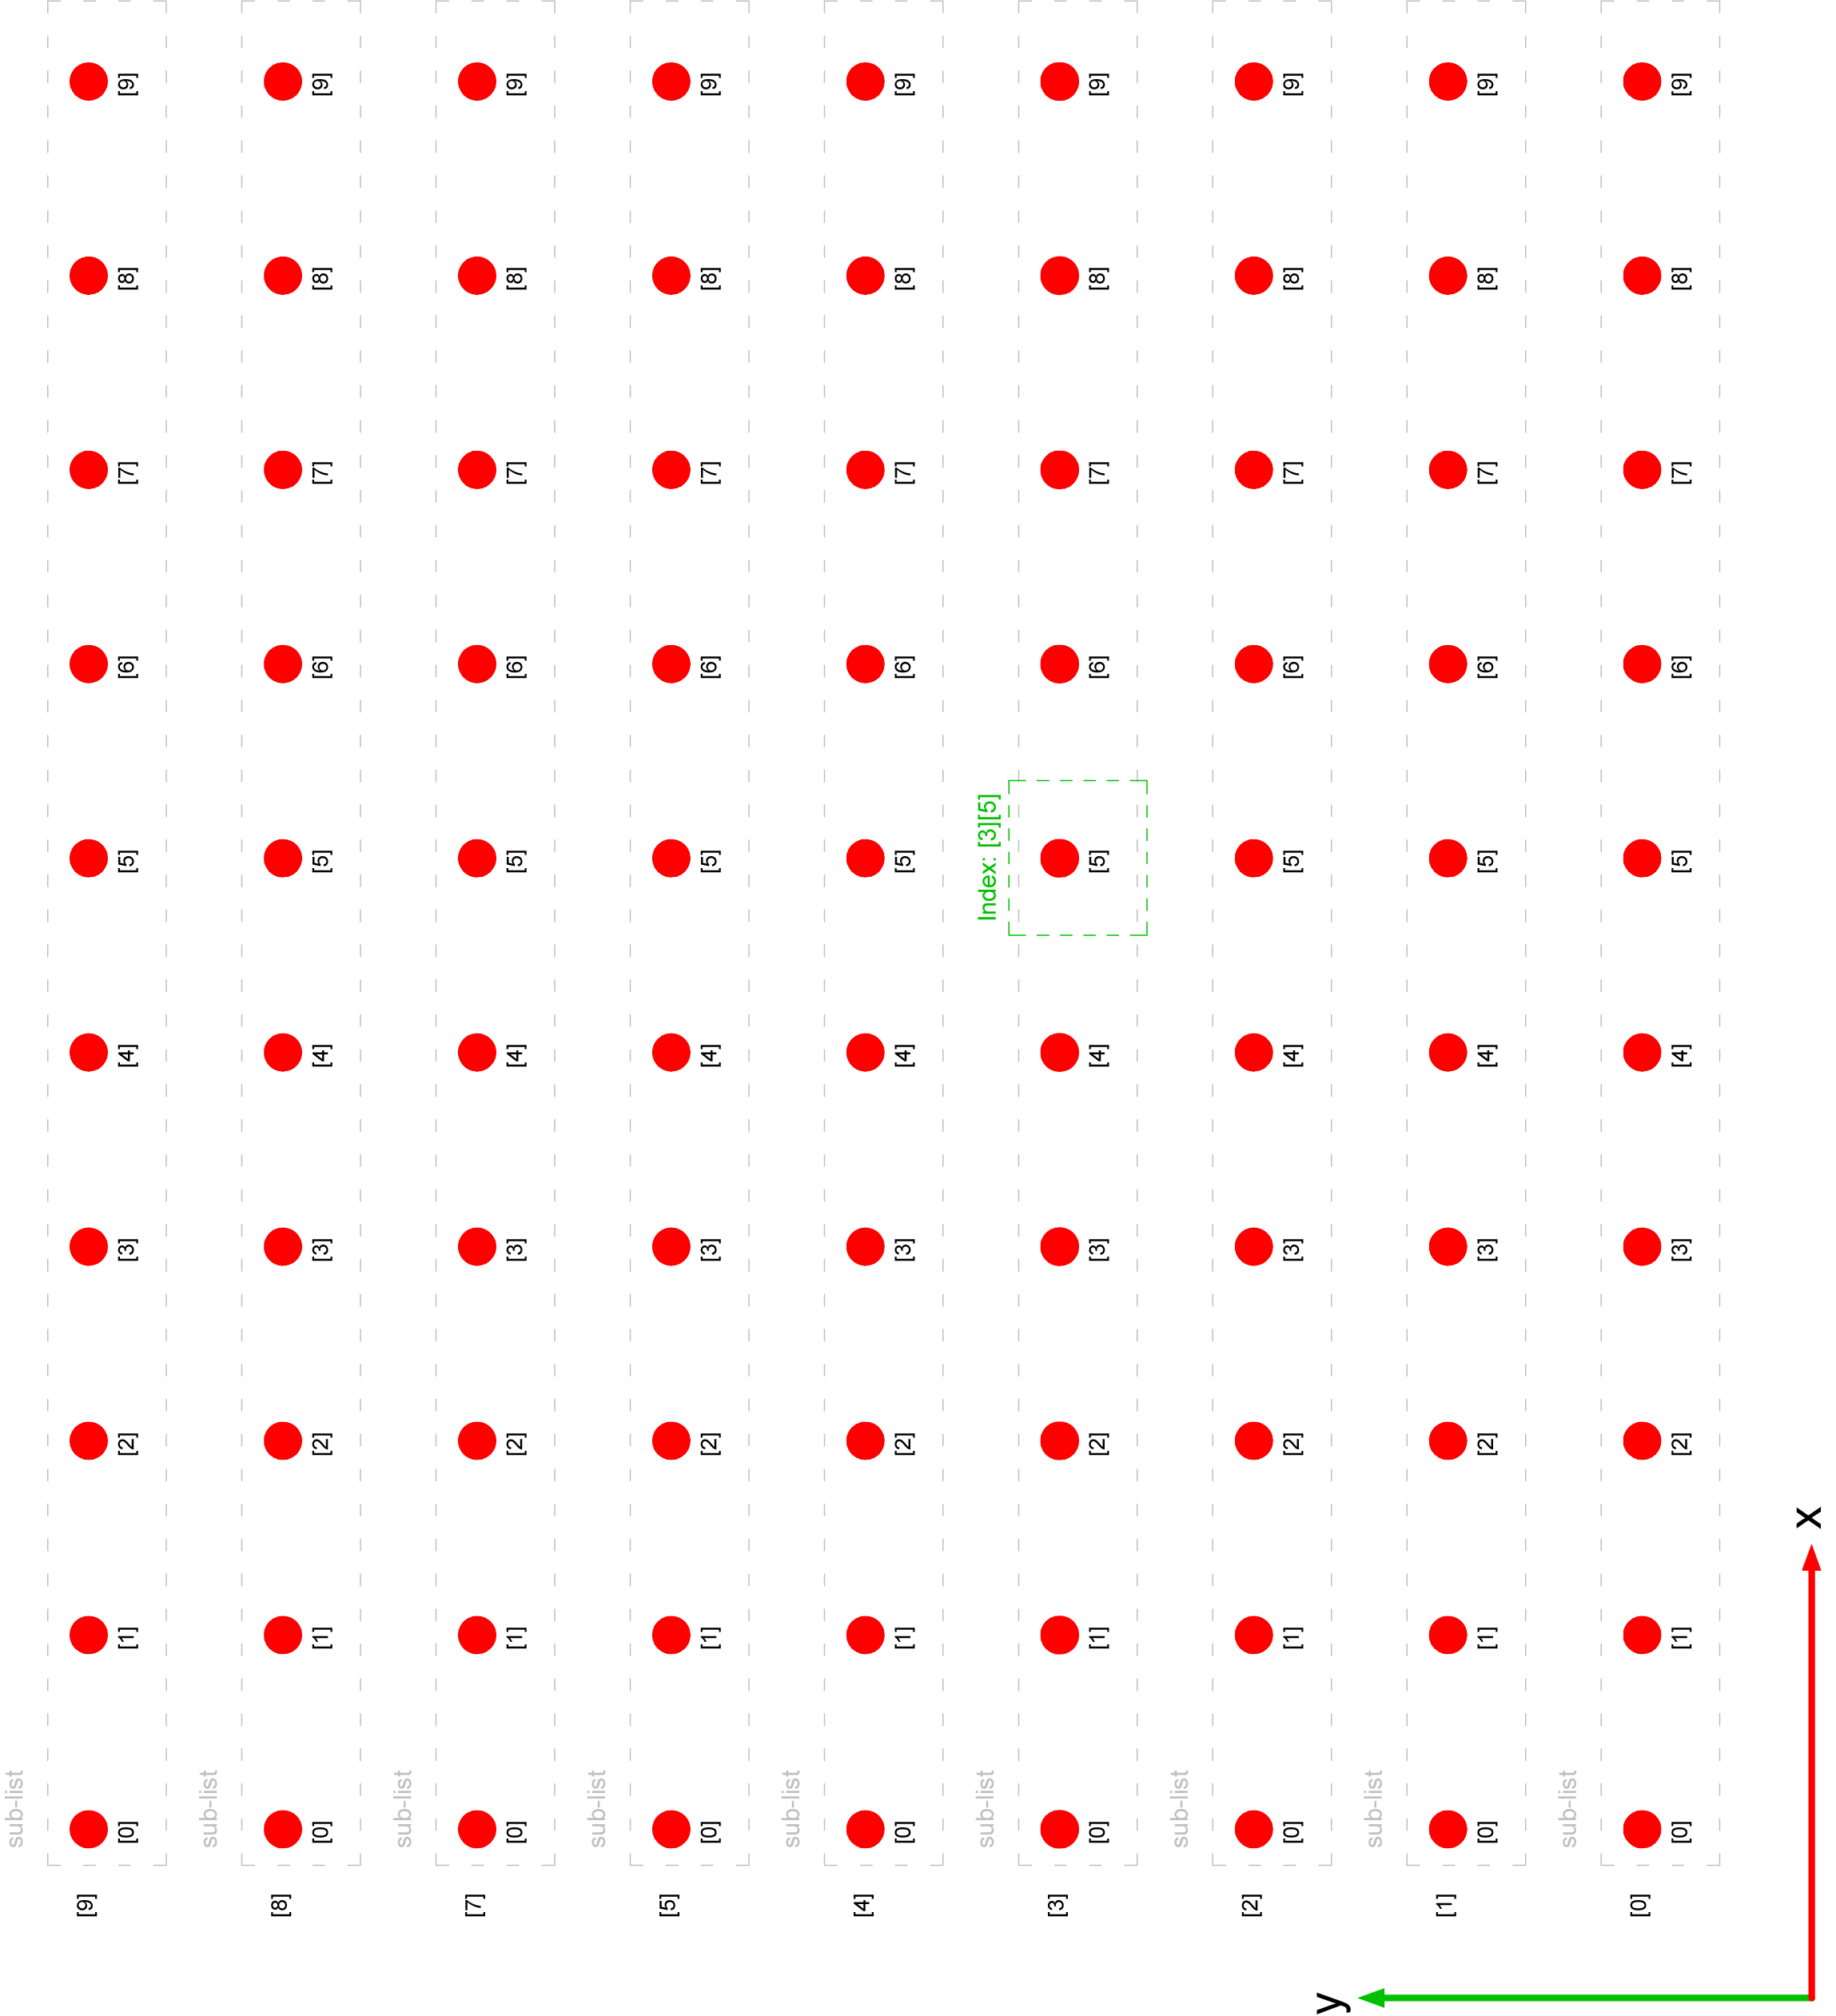 The point grid as a list of lists —
 [row][column] indexing.
Group the nodes and give the group a meaningful name to complete the step.